
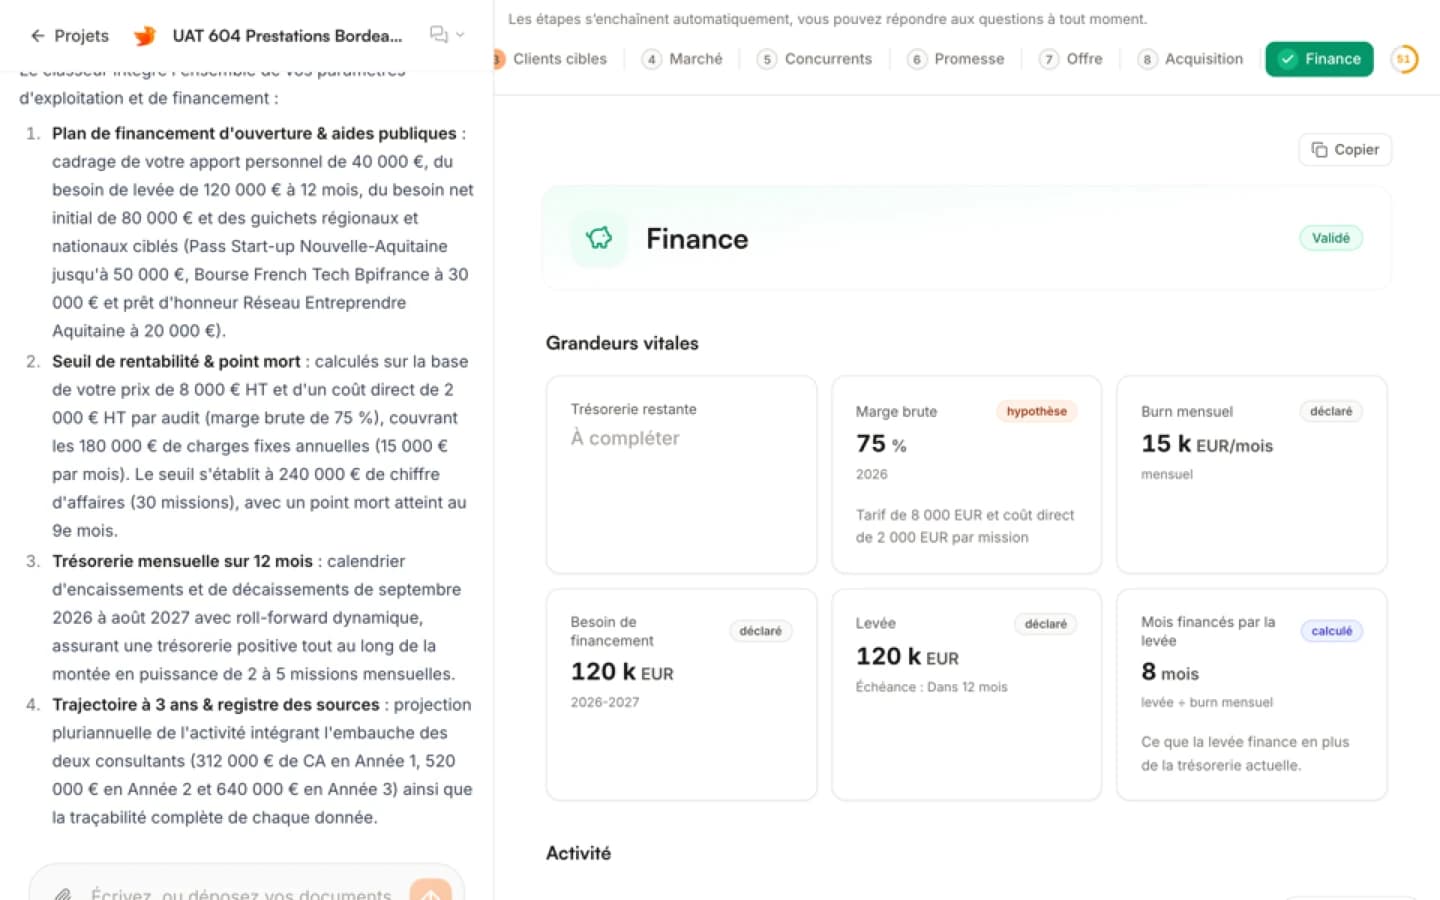
Presenting complex financial data to an executive committee, board of directors, or institutional investment panel requires both visual clarity and rigorous accessibility. For decision-makers who rely on assistive technology, a standard visual chart of monthly recurring revenue, gross margins, or cash runway is completely opaque unless paired with structured equivalent text. Choosing between the World Wide Web Consortium (W3C) two-part complex image description model and raw screen-reader data tables determines whether your audience extracts immediate strategic insights or gets trapped in mechanical data parsing.
The W3C two-part description model splits an image alternative into a short identifier and a detailed, narrative-driven long description that conveys scales, data points, and broader commercial trends. In contrast, raw screen-reader tables expose the underlying data grid directly to assistive software cell by cell. While both approaches aim to eliminate information asymmetry, executive pitch decks impose specific constraints on space, cognitive load, and pacing that dictate when to deploy narrative summaries and when to expose tabular data.
The W3C Two-Part Description Model: Narrative Clarity for Executive Audiences
The Web Accessibility Initiative of the World Wide Web Consortium outlines clear requirements for handling complex graphics in its guidance on W3C complex images. When visual content contains more information than a short sentence can convey, accessibility standards require a two-part text alternative. The first component is a concise short description that identifies the graphic and indicates where to locate further details. The second component is a comprehensive long description that presents the essential information, including data values, column relationships, and overarching performance trajectories.
In high-stakes executive pitch decks, the W3C model provides distinct advantages:
- Strategic context over discrete cells: Senior stakeholders reviewing financial trends want to grasp directional shifts immediately. A narrative description captures inflections, such as quarterly recoveries or seasonal dips, without forcing the listener to calculate differences mentally across dozens of individual cells.
- Universal availability: The W3C guidance explicitly recommends making long descriptions accessible to all viewers, such as integrating the explanation into the primary slide content. Complex graphics present cognitive hurdles for diverse viewers, including individuals with low vision, learning differences, or limited familiarity with specific domain metrics.
- Multimodal cohesion: Placing an explicit text summary beside a chart anchors the verbal pitch. As highlighted in the W3C tutorial, referencing the visual directly with phrasing like a note explaining that visitors dropped in a first period but recovered in a second period grounds the slide for sighted readers and screen-reader users simultaneously.
To maintain brevity in executive summaries while keeping depth available, presenters often reference detailed supporting materials in the Knowledge guides for finance to ensure complex modeling assumptions remain transparent without overwhelming visual slides.
Raw Screen-Reader Tables: When Precision Demands Tabular Structure
Raw data tables represent the classic baseline for accessible data presentation. Instead of relying on qualitative summaries, the presentation embeds a native table where each cell has defined column and row headers. Assistive technology like screen readers allows users to traverse this grid longitudinally, cross-referencing values across periods, product lines, or business units.
However, raw tables introduce distinct trade-offs in executive presentations:
- High cognitive processing overhead: Navigating a fifteen-column financial model using keyboard navigation requires users to retain intermediate figures in working memory. If an investor wants to understand overall burn efficiency, traversing twenty individual cost lines delays comprehension.
- Visual real estate conflict: Pitch decks operate under intense space constraints. Displaying both a high-impact visual chart and an extensive tabular layout on a single slide often leads to micro-typography that degrades visual legibility.
- Loss of executive hierarchy: A raw table treats every metric with equal visual and structural weight. Unless secondary styling or summary rows guide the reader, critical inflection points can be lost in the sheer volume of data.
When founders build investor presentations, maintaining narrative focus is paramount. As explored in the analysis on why investors stop reading pitch decks after 3 minutes, excessive visual noise and unstructured data dumps routinely cause prospective backers to disengage before reaching the investment ask.
Comparing the W3C Two-Part Approach and Raw Data Tables
The decision to implement a narrative two-part description or an embedded data table hinges on the intended utility of the slide. Fast-paced executive pitches require different communication mechanics than technical financial diligence sessions.
| Evaluation Criterion | W3C Two-Part Description | Raw Screen-Reader Table |
|---|---|---|
| Cognitive speed | Rapid synthesis of key trends and critical inflections | Methodical cell-by-cell examination |
| Slide space required | Minimal text footprint alongside visual chart | Substantial visual area needed for full grid |
| Screen-reader efficiency | Delivers executive conclusions in one or two passages | Demands active multidirectional keyboard navigation |
| Granular verification | Requires separate appendix for minute data checks | Enables direct audit of individual figure relationships |
| Authoring effort | Requires drafting clear summary prose | Requires tagging headers and aligning cell coordinates |
In adjacent slide content, combining these mechanisms often yields the best outcome. Presenters can feature the W3C two-part summary directly on the primary deck slide, while placing the raw data table in an appendix slide or linked financial supplement.
Authoring Accessible Slides Across PowerPoint and PDF Workflows
The practical execution of accessible financial slides depends heavily on your production workflow and final document format. Many presenters assume that modern presentation software handles chart accessibility automatically, but official platform specifications reveal critical manual requirements.
According to official support documentation from Microsoft on making presentations accessible, PowerPoint under Microsoft 365 can automatically generate alternative text for photographs, stock imagery, and built-in icons, but alt text for charts, shapes, screenshots, and diagrams must be written manually. The same guide warns authors against relying on text inside images as the sole mechanism for conveying critical data, urging presenters to repeat key textual figures directly on the slide body, and to restrict standard alt text to a short sentence or two.
Structuring reading sequence is equally essential. Microsoft outlines in its reference on the PowerPoint Reading Order pane that screen readers process slide elements strictly according to their numerical sequence in the reading order list. If a chart graphic precedes its explanatory text box in the panel order, a screen-reader user hears the visual container before the surrounding context. Presenters must actively open the Accessibility Checker, inspect object sequencing, and manually verify that narrative descriptions precede or immediately follow corresponding visual graphics.
File format choices also alter accessibility outcomes:
- Native PowerPoint (.pptx): Preserves live text boxes, vector shapes, and structural tags. Screen readers can interact with slide text directly, provided the author maintains clean reading order and populates image descriptions.
- Exported PDF files: Many presentation platforms export slide decks by rendering each page as a flat raster graphic. A rasterized PDF contains no selectable text, no accessibility tags, and no reading tree. Screen readers cannot interpret rasterized slides unless the author remediates the document in a dedicated editor like Adobe Acrobat or delivers an accessible text companion document.
For founders utilizing automated slide creation platforms, understanding the underlying export architecture is necessary. In Ember Creation, slide decks can be exported as PDF documents or PowerPoint (.pptx) files. Creation exports PDF pages as raster images without embedded text tags, meaning assistive tools cannot parse them directly. When exporting to PowerPoint, Creation maps slide text into native text boxes, but rasterizes embedded Scalable Vector Graphics (SVG) charts into images without generating automated alternative text. To make these presentations fully compliant, authors must manually add chart descriptions in PowerPoint or state the core figures in visible slide text boxes alongside the visual.
Compliance Horizons: Section 508 and European Standards
Digital accessibility in procurement and investor relations is shifting from an optional best practice to a contractual mandate. Institutional clients and government entities enforce strict technical thresholds for digital documentation.
In the United States, federal accessibility standards stem from statutory rules. On January 18, 2017, the U.S. Access Board published a final rule updating accessibility requirements for information and communication technology covered by Section 508 of the Rehabilitation Act and Section 255 of the Communications Act, as documented by Section508.gov.
Adherence across enterprise and public ecosystems remains an ongoing operational challenge. Reporting published on March 16, 2026, by Federal News Network highlights that over 70 million U.S. adults report having a disability, yet fewer than half of federal agencies' most viewed public-facing information and communication technologies comply with Section 508 standards, with only 37% of top-viewed federal websites achieving full conformance. As procurement scrutiny intensifies, enterprise buyers increasingly audit the accessibility conformance of commercial vendor presentations and deliverables.
In Europe, technical standards are aligning around newer benchmarks. According to an official bulletin published on September 7, 2026, by the European Commission initiative AccessibleEU, standard EN 301 549 v4.1.1 has adopted Web Content Accessibility Guidelines (WCAG) 2.2 as the accessibility benchmark for digital documents and software, adding six new accessibility requirements while eliminating the legacy parsing criterion. While EN 301 549 v3.2.1 from 2021 remains the active legal baseline under WCAG 2.1 Level AA until formal citation in the Official Journal of the European Union, the regulatory trajectory clearly points toward stringent document formatting across corporate and institutional reporting.
Structuring Executive Slides: The Recommended Hybrid Pattern
To achieve compliance without compromising design or visual storytelling, pitch deck creators should adopt a hybrid presentation layout that unites W3C principles with clean layout mechanics:
- State the strategic takeaway in the primary header: Instead of generic labels like "Revenue Growth", use an assertion headline such as "Annual Recurring Revenue Expanded Across Enterprise Tiers".
- Feature the visual chart with concise alt text: Keep the embedded graphic uncluttered. If using PowerPoint, manually assign an alternative description identifying the chart type, axis variables, and the presence of the accompanying callout.
- Embed visible text callouts beside the graphic: Write a short W3C-style narrative block directly on the slide surface. State the starting baseline, the final figure, and the underlying growth rate. Because the text is visually displayed, sighted reviewers, individuals with cognitive differences, and screen-reader users all receive the exact same insight.
- House tabular data in an appendix: For reviewers conducting detailed due diligence, place raw data tables on dedicated appendix slides. Ensure these tables contain proper row and column headers and follow a logical reading order.
When preparing to pitch, visual polish represents only half the challenge. Teams must also articulate these figures convincingly during oral presentations. Using dedicated deck practice features, such as the speaking practice module in Ember Creation which analyzes vocal pacing, pause structure, and rhetorical delivery against slide content, ensures that your spoken narrative reinforces the accessible data presented on screen. For teams assessing generative presentation options, our direct review of Claude vs Ember Creation illustrates how contextual data integration shapes production speed and structural consistency across executive decks.
Sources
- Section508.gov: Home
- IT accessibility/Section 508
- Section 508 report eyes acquisition 'lever'
- W3C WAI, Complex Images : source S1
- Microsoft, Make your PowerPoint presentations accessible to people with disabilities : source S2
- Microsoft, Make slides easier to read by using the Reading Order pane : source S1
- AccessibleEU (Commission européenne), The European accessibility standard EN 301 549 has been updated : source S1
- Ember Création, artefacts visuels éditables
FAQ
Mini audit
Test your Pitch Deck
Get an initial diagnosis of substance, form and impact.