
Enterprise software deals rarely die because the product lacks features. They die in finance committees. At the final decision stage, the buyer is no longer evaluating usability or technical architecture: the finance office wants to know in how many months the business will recover the cash committed to this purchase.
The temptation is to answer doubt with a massive ROI figure. The credible move is the opposite. A credible ROI slide does not promise windfalls: it shows a clear narrative arc, separates proven savings from fragile projections, and demonstrates a payback period anchored in the prospect's operating reality.
Why inflated ROI models destroy credibility
Most sales proposals aggregate every conceivable benefit into a single headline figure: hypothetical minutes saved multiplied across hundreds of employees, an arbitrary hourly rate, and declared millions in productivity gains.
Finance teams spot the assembly immediately. Diffuse productivity savings rarely translate into reduced payroll or real cash. When a business case rests on stretched assumptions, controllers discount the entire argument. Slidor, an agency that designs sales presentations for executive committees, states it plainly: an overly optimistic first-year ROI above 500% can harm your credibility; the recommendation is to stay conservative and transparent about assumptions (Slidor).
A defensible payback calculation focuses on cash impact:
- Net displacement of existing spend, such as removing a competing subscription or external agency fees.
- Error-rate reduction, with verified and measurable remediation costs.
- Reallocation of already-budgeted resources toward revenue-generating work.
Presenting the conservative scenario first disarms the financial reviewer. When the numbers survive scrutiny by internal controllers, the project sponsor can champion the purchase without fearing a veto.
The slide order that keeps a committee's attention
Showing the profitability calculation in isolation reads as arbitrary price defense. The sales presentation must lead naturally to the investment decision.
Slidor recommends splitting presentation time across four blocks: 20% for restating the context, 40% for the solution, 30% for value demonstration and 10% for next steps (Slidor). This distribution makes the committee understand the financial stakes before unit costs.
Problem context (20%) -> Solution (40%) -> Value and payback (30%) -> Action plan (10%)
1. The problem slide as cost baseline
Before discussing value, align on the cost of the status quo. The problem slide documents current workflow friction and quantifies what the organization loses each month. If the prospect agrees their operating model costs real money, your payback timeline already has a benchmark.
2. The solution and proof slide
Show how the mechanism removes the baseline cost. Tie each functional advantage to an operational outcome instead of listing features. Slidor states, in a “key point” box published with no primary source, that prospects are 92% more likely to trust a customer recommendation than a direct sales pitch (Slidor): a comparable case beats a promise.
3. The value and payback slide
This is where unit economics meet operational reality. The slide lays out implementation fees, recurring charges and verifiable annual savings without hiding assumptions.
4. The mutual action plan
Close with the steps that lead to the projected payback milestone: deployment schedule, validation checkpoints, ownership on both sides. Committee reading logic mirrors investor logic: Seed pitch: the slide a VC partner actually examines shows the decision-maker looks first for proof they can defend.
The payback calculation to make visible
The payback slide shows the exact point on the calendar where cumulative savings cross total spend. The method detailed by Slidor breaks a transparent model into five components (Slidor):
- Initial investment: licence, implementation and training.
- Recurring costs: annual subscriptions and maintenance.
- Annual gains: savings and additional revenue.
- Year-one ROI: gains minus costs minus investment, divided by investment.
- Payback period: the number of months to break-even.
Slidor's published example illustrates the calculation: an initial investment of 50,000 euros, annual costs of 12,000 euros and annual gains of 85,000 euros produce a 46% first-year ROI and an 8-month payback. The example values gross gains at roughly 7,000 euros a month before recurring costs; an actual delay cost requires verified cash effects (Slidor).
| Model Variable | Metric Description | Practical Commercial Rule |
|---|---|---|
| Upfront Capital | Initial onboarding and licensing | State all mandatory setup fees explicitly without hiding service charges |
| Ongoing Costs | Recurring annual subscription | Include expected maintenance and platform expansion costs |
| Tangible Gains | Hard cash savings and error reduction | Exclude theoretical soft time savings from the primary break-even formula |
| Payback Horizon | Months required to recover cash | Show the horizon calculated from verified buyer cash flows and costs |
Keeping these variables visible in a clean layout prevents the presentation from looking like a black box. The buyer can adjust assumptions during the meeting without breaking the underlying logic.
The objections to disarm before the price question
When executives ask what makes a committee say yes, the answer is one word: risk reduction. Decision-makers do not buy the highest projected return; they buy the outcome their organization can actually execute.
A deck for a conservative committee succeeds when it answers three unstated objections:
- What if adoption is slow? Show a scenario where slow onboarding pushes payback back one quarter and the purchase still yields positive net value.
- Who owns the measurement? Name the operational metric the internal sponsor will track monthly to verify value creation.
- Is the baseline verified? Clearly separate the figures the prospect provided during discovery from those drawn from your references.
Slidor recommends positioning pricing after the value and ROI demonstration, and reframing the price objection around the cost of inaction: with 85,000 euros in annual savings, the example’s gross gains are about 7,000 euros per month before recurring costs (Slidor). Acknowledging project constraints shifts the conversation from defending price to planning deployment. For the same reasoning applied to tool selection, What evidence should a bootstrapped founder bring to Creation? details a useful control.
Building the slide with Creation in Ember
Turning financial reasoning into a readable visual is often where sales teams lose time. Standard slide software encourages decoration over decision and forces manual adjustment of every text box.
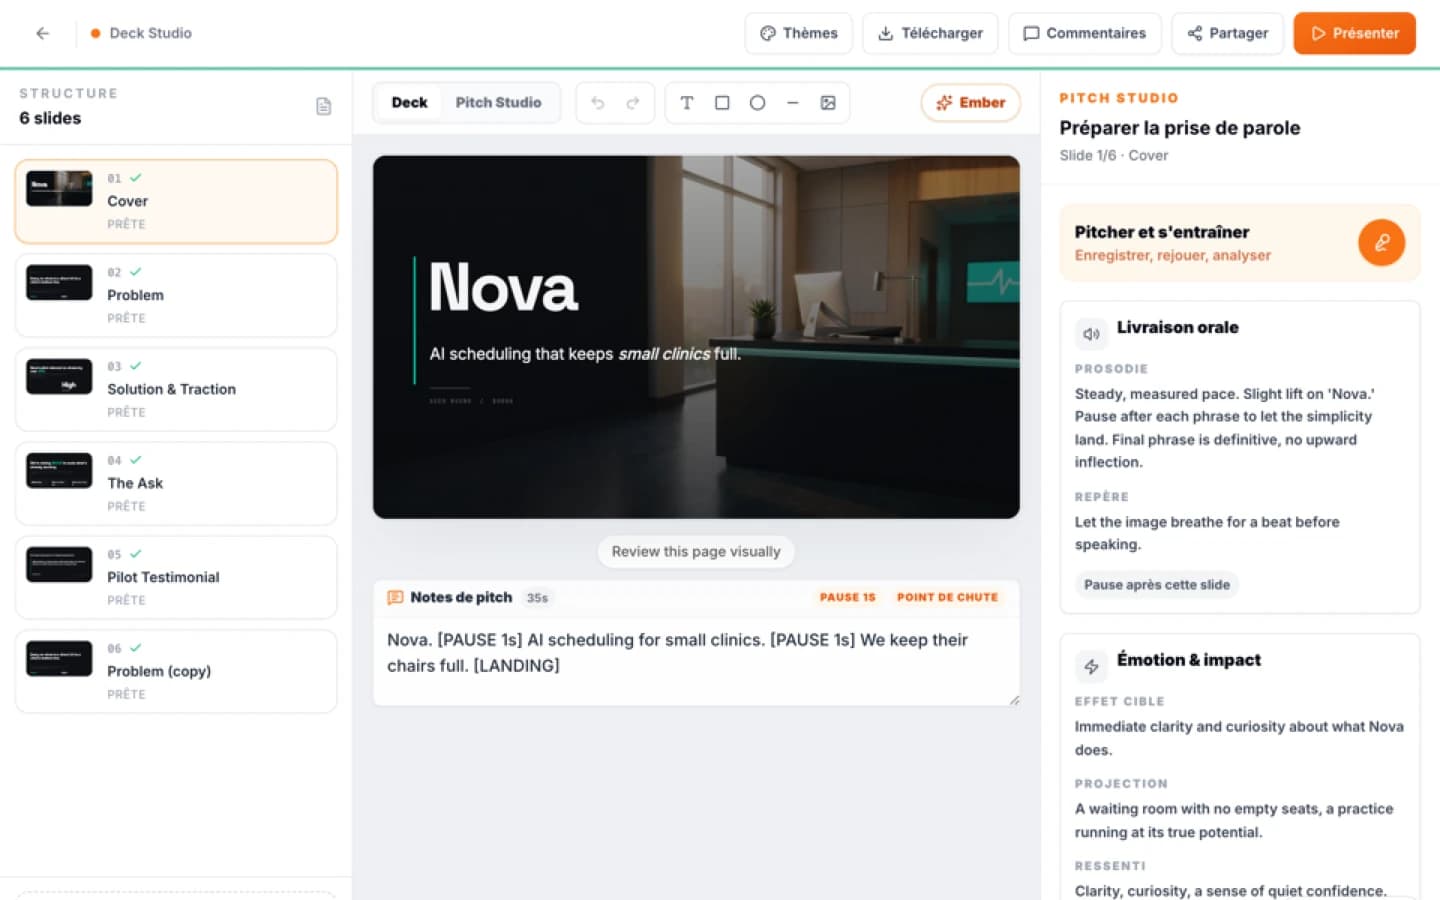
Creation can help structure a presentation from project context and prepare speaker notes. Its public page does not document one-pagers, market maps, automatic metric citations or specific export guarantees. Verify every financial claim and test the final file in the current application before a committee meeting.
A credible payback slide does not require an inflated promise. Anchoring your financial argument in transparent assumptions, a measurable payback timeline and clear narration turns procurement into an operational partnership.
Sources
FAQ
Mini audit
Test your Pitch Deck
Get an initial diagnosis of substance, form and impact.