
Structuring a B2B sales deck around the cost of inaction means shifting attention from what your software does to what your buyer loses every month by changing nothing. Most sales presentations collapse into a pile of screenshots and feature lists, inviting the prospect to compare technical line items rather than evaluate a business risk. When an enterprise deal stalls, the real competitor is rarely another vendor: it is the status quo.
Dock's sales deck library, published August 19, 2025 and updated July 9, 2026, recalls two useful benchmarks: according to Salesforce, a presenter has about 30 seconds to hook the audience, and personalized content lifts average reading time by 41% while being shared internally 2.3 times more often. A ten-slide sequence centered on the cost of inaction turns a pitch into a decision document.
Why feature-first decks lose to the status quo
Leading with features forces the buyer to do all the translation work: map every improvement to their budget, compute a hypothetical return, then defend that math to their committee. That cognitive load creates friction. When the current method feels tolerable, the safest call for an executive is to defer the project.
A deck centered on the cost of inaction reverses this dynamic: instead of asking the buyer to imagine future gains, it shows that inaction is a daily financial decision carrying a recurring price. The goal is not to display engineering prowess, but to make the cost of standing still higher than the deployment friction, budget allocation, and switching cost of your solution.
The ten-slide architecture
To convince a committee, each slide must follow from the previous one: the sequence first establishes the context shift, quantifies the waste, and introduces the product only after the financial stakes are clear. This progression follows the Duarte firm's presentation method: run your idea and structure past others before you dig into designing slides.
Slide 1: the context shift
Open with an undeniable market reality or regulatory change that alters how your buyer must operate. When the prospect accepts your diagnosis of this structural shift, they read everything that follows through that lens.
Slide 2: the core problem behind the status quo
Show why the legacy process fails under current requirements. The issue is neither the people nor an outdated tool, but the structural limits of the existing organization and the bottlenecks created by manual workarounds.
Slide 3: the compounding cost of inaction
This is the presentation's pivot. Quantify what happens if nothing changes: direct costs (lost hours, external contractors, compliance exposure) and indirect costs (pipeline leakage, team turnover, slower delivery cycles). For the visual layout of this section, see how to design the cost of inaction slide.
Slide 4: the strategic fork
Present two trajectories: keeping the current workarounds, whose overhead grows while capacity stays flat, or reasoned modernization. Deciding nothing amounts to actively choosing the first path.
Slide 5: the solution criteria
Before showing screens, formalize the criteria any viable solution must meet. You help the buyer structure their evaluation while disqualifying superficial alternatives.
Slide 6: the operating mechanism
Introduce your platform as the embodiment of those criteria. Show only the workflows directly tied to reducing the losses quantified on slide 3.
Slide 7: validated proof
Bring concrete elements showing how similar organizations solved the same problem, with precise indicators (recovered margin, reduced cycle times) rather than vague testimonials.
Slide 8: de-risked deployment
Answer the silent objection in every enterprise purchase: the fear of an endless integration. Describe a phased plan delivering early results with minimal commitment from the buyer's teams.
Slide 9: the economic comparison
Set the predictable cost of your solution against the accumulated losses of the status quo: the contract value appears as a fraction of the cost of inaction.
Slide 10: the immediate next step
End with a concrete, bounded action: a preliminary technical audit, a data assessment, or a joint economic modeling session, rather than a passive "questions?" screen. On this specific point, the closing commitment slide details how to replace the empty close with an engagement, and the meeting structure that drives decisions extends the method.
| Presentation stage | Feature-centric approach | Cost-of-inaction approach |
|---|---|---|
| Opening | Company history and client logos | Structural market shift affecting operations |
| Problem | Missing tools and disconnected platforms | Daily financial leak and compounding waste |
| Product reveal | Full interface and menu walkthrough | Targeted mechanisms that stop the quantified losses |
| Validation | Sympathy testimonials and prestige logos | Measured margin and cycle-time recovery by peers |
| Close | Pricing grid and standard licenses | Economic comparison of investment versus status quo |
Turning operational friction into defensible metrics
To make the cost of inaction irrefutable, ban projections finance leaders dismiss on sight. Ground the indicators in the prospect's reality:
- Identify the measurable unit of loss: wasted engineering hours, support delays, unbilled services, or contractual penalties.
- Set a conservative baseline: recognized compensation costs or accepted sector benchmarks rather than inflated gain ratios.
- Multiply across headcount and duration: show how a daily loss repeated across a whole team becomes a massive volume of wasted hours per quarter.
- Separate ledger losses from opportunity drag: distinguish direct cash outflows from mere growth delays so the CFO can validate the rigor of the base calculation.
A conservative, transparent demonstration invites the prospect to audit the math: even adjusted downward, if status quo losses still clearly exceed your contract price, the decision makes itself.
Building the deck with Creation in Ember
Building an argument that surfaces economic urgency requires narrative rigor that generic template libraries do not provide: they favor visual decoration over analytical clarity.
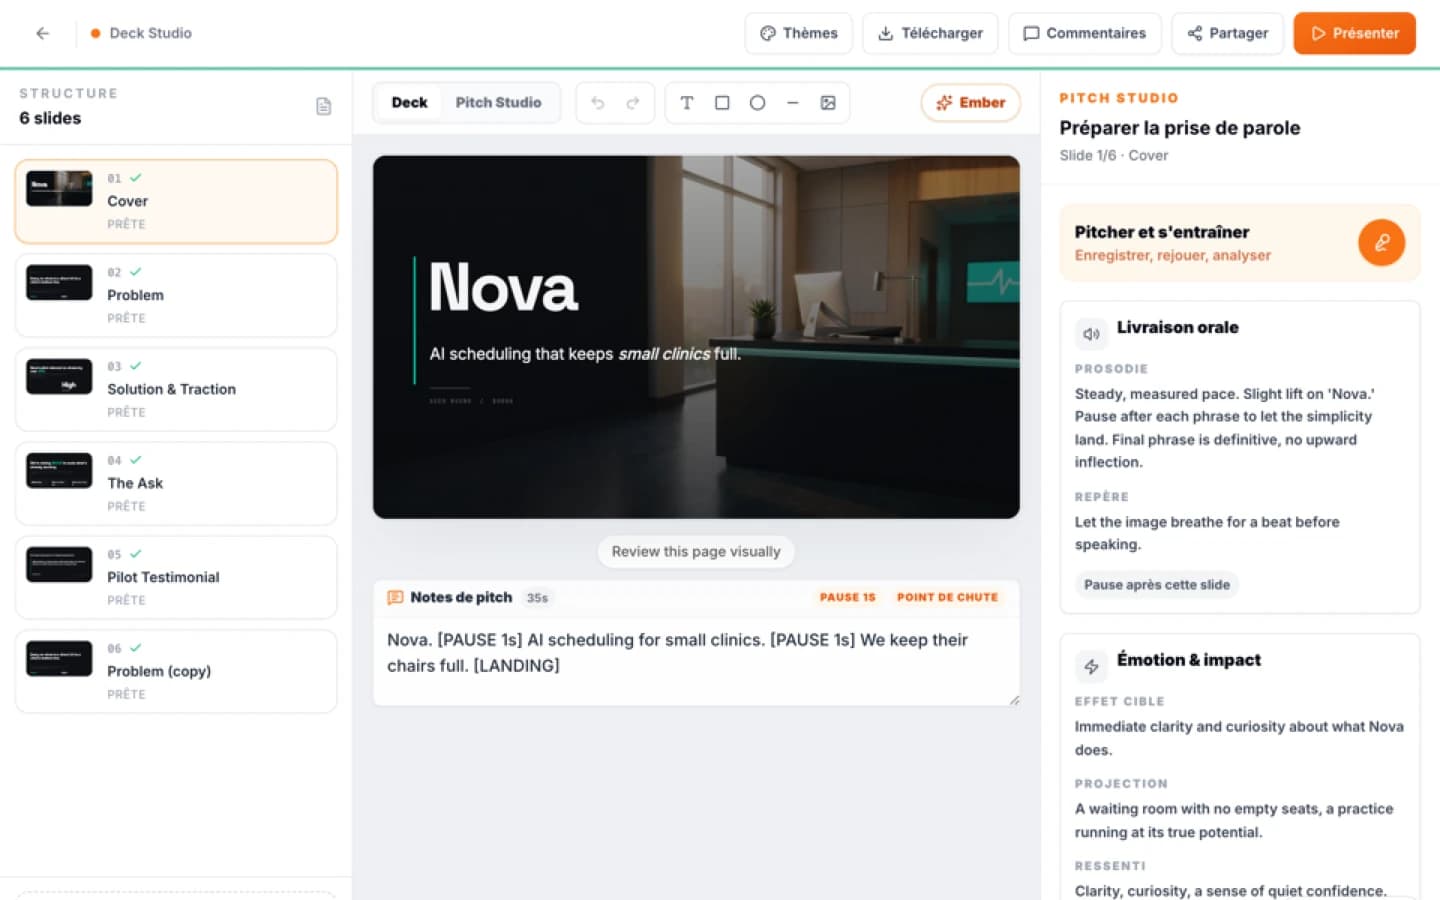
With Creation, Ember's visual module, sales teams build the asset from their project's documented context rather than an impersonal template. The module analyzes the substance and structures the narrative thread before generating the chosen format among eight: decks, one-pagers, business model canvases, market maps, LinkedIn posts, YouTube thumbnails, OG images, and stories. At generation completion, texts are fitted to their zones and may be shortened once by the model, with remaining overflows flagged; every element stays editable through targeted, undoable edits. A deck exports as PDF or PowerPoint (.pptx), the other seven formats as PNG. Speaking practice finally lets teams record, replay, and rehearse a deck while analyzing the take's rhythm, clarity, impact, and structure; it covers decks only, not the other formats.
To turn your economic analysis into a committee-grade decision document, start with Creation in Ember. And if your argument must also convince investors, adapting a pitch deck into a sales deck explains what changes between the two exercises.
Sources
FAQ
Mini audit
Test your Pitch Deck
Get an initial diagnosis of substance, form and impact.